.png)
.webp)

Growth Marketing Metrics: The 11 Numbers That Actually Drive Decisions
.png)

.png)

In 2026, sustainable growth is measured by 11 core metrics focused on capital efficiency: LTV, CAC, LTV: CAC Ratio (3:1 benchmark), Payback Period (<12 months), and AI Search Visibility. Modern teams also prioritize Activation Rate, Viral Coefficient, Churn, CVR, Rule of 40, and GEO (Generative Engine Optimization) to ensure visibility in AI-driven discovery channels.
Key Takeaways
- Growth in 2026 is constrained by unit economics and capital efficiency
- Metrics must be analyzed as an interconnected system
- AI-driven discovery is reshaping how visibility and demand are generated
- Sustainable growth depends on balancing acquisition, retention, and monetization simultaneously
How is Growth Marketing Changing in 2026?
Growth marketing in 2026 is defined by a shift toward financial efficiency, driven by rising acquisition costs and the integration of AI systems into decision-making. This shift is often described as Growth Hacking 3.0, where experimentation is constrained by profitability requirements rather than pure scale.
Growth is no longer a function of traffic volume alone. It is now a system-level discipline combining:
- Unit economics modeling (profit per customer)
- Predictive analytics (forecasting behavior using historical data)
- Multi-channel discovery systems, including AI answer engines and social platforms
Key structural changes:
- Acquisition costs have increased, compressing margins and forcing stricter targeting
- Search behavior has fragmented, with users relying on AI assistants, voice queries, and social proof
- Data pipelines are centralized, enabling real-time decision-making across marketing, product, and sales
Modern growth teams increasingly use centralized data pipelines built with tools such as Segment, Snowflake, and Claude-powered analytics workflows to unify behavioral, revenue, and product data. These systems often connect to vector databases, allowing teams to model real-time user intent from semantic signals, product interactions, and historical behavior.
The result leads to growth teams now optimizing for capital efficiency, not just user acquisition.
11 Essential Metrics for Sustainable Scaling in 2026
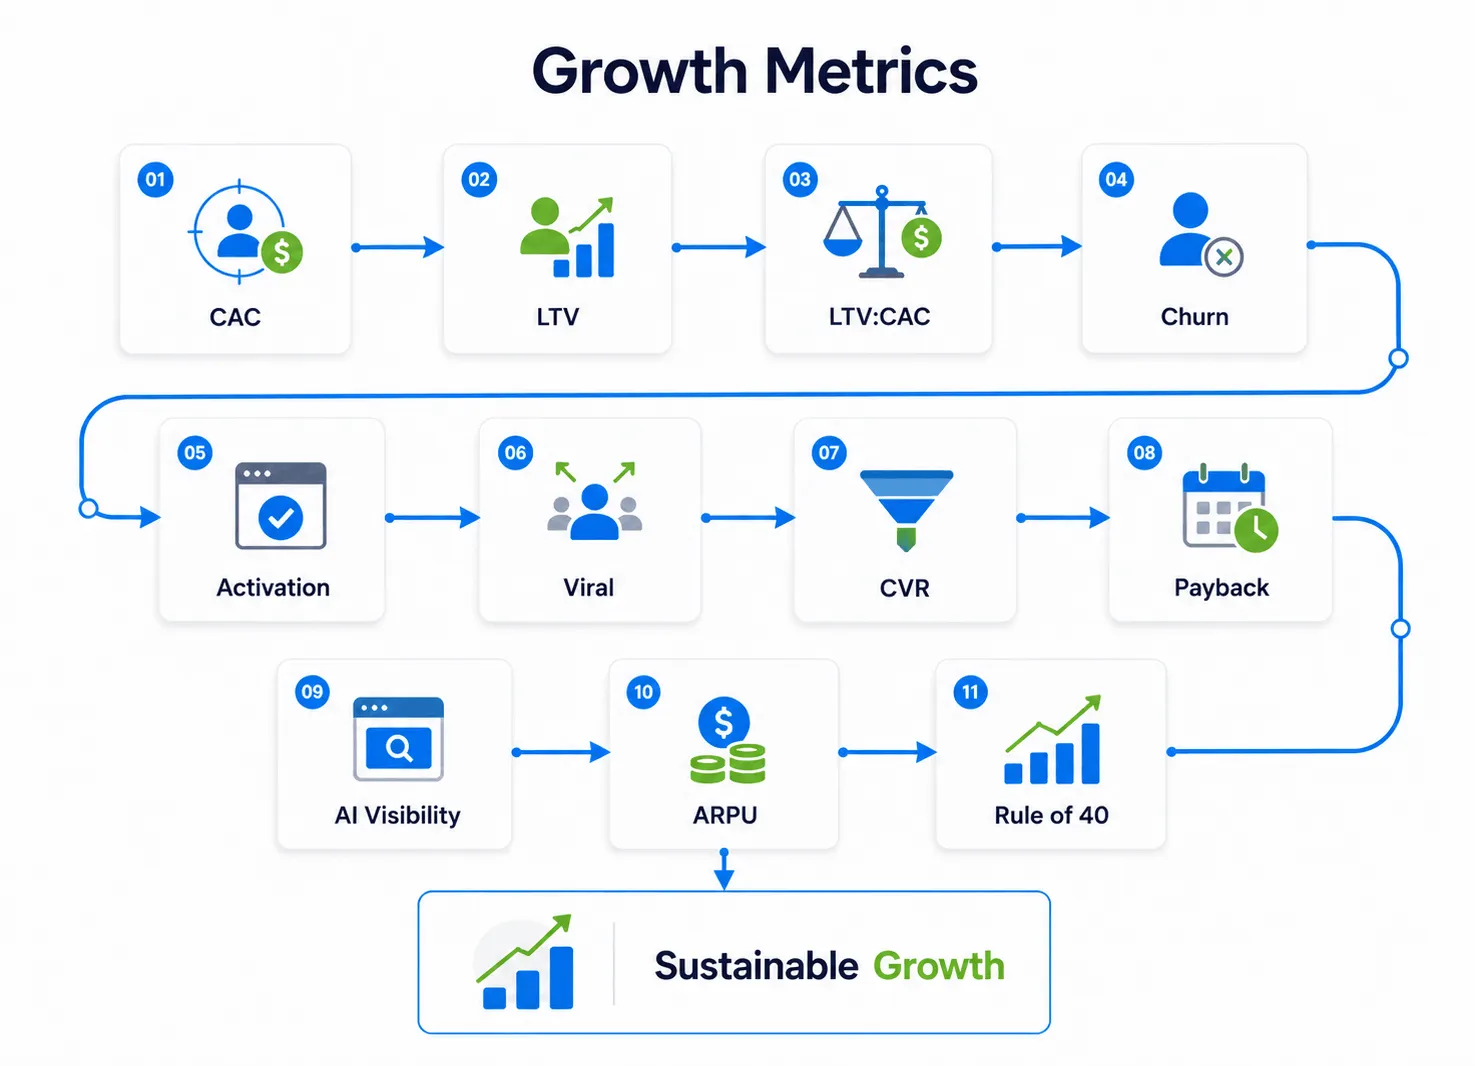
These metrics form an interconnected system. Each one captures a specific constraint or lever within the growth model—acquisition efficiency, retention stability, monetization depth, or scalability.
1. Customer Acquisition Cost (CAC)
Customer Acquisition Cost (CAC) measures the total cost required to convert a new customer, including advertising spend, marketing salaries, and tooling overhead allocated to acquisition.
CAC defines the input cost of growth. If CAC rises without a proportional increase in customer value, the business model deteriorates.
- Treat CAC as a segmented metric, not a global average:
- CAC by channel (paid search, organic, partnerships)
- CAC by customer segment (enterprise vs SMB)
- Identify high-intent behavioral signals (e.g., repeated pricing page visits, demo requests) to prioritize spend
- Reduce CAC volatility by investing in owned channels (SEO, content, community)
The goal is not to minimize CAC universally, but to ensure CAC is predictable, scalable, and justified by downstream revenue.
2. Customer Lifetime Value (LTV)
Customer Lifetime Value (LTV) estimates the total net revenue generated by a customer over their lifecycle, adjusted for gross margin and churn. LTV is a forward-looking constraint on acquisition strategy. It determines how aggressively a company can invest in growth.
- Use cohort-based LTV, not blended averages:
- Compare LTV by acquisition channel or signup period
- Distinguish Revenue LTV from Contribution Margin LTV:
- Revenue LTV measures the total revenue a customer generates over time
- Contribution Margin LTV subtracts variable costs such as support, infrastructure, payment processing, implementation, and servicing costs
- Contribution Margin LTV is the better metric for acquisition decisions because it shows how much economic value is actually available after delivery costs
- Monitor LTV expansion drivers:
○ Upsells, cross-sells, usage-based billing, seat expansion, and retention improvements
LTV is most useful when it is tied directly to cash flow modeling, pricing strategy, and contribution margin, not treated as a static revenue metric.
3. LTV to CAC Ratio
The LTV:CAC ratio compares the lifetime value of a customer to the cost of acquiring them, serving as a primary indicator of economic viability. This ratio determines whether growth is profitable, neutral, or destructive.
- Use it as a budget allocation tool:
- Channels with higher LTV:CAC receive more capital
- Identify structural issues:
- Low ratio → either CAC is too high or retention/monetization is weak
- Avoid over-optimization:
- Extremely high ratios (e.g., 10:1) may indicate underinvestment in growth
The ratio should guide capital deployment decisions, not just reporting.
4. Churn Rate
Churn rate measures the percentage of customers who stop using a product within a defined time period, typically monthly or annually. Churn introduces systemic leaks into the growth model, implying certain funnel stages break user intentions to convert. High churn forces constant reacquisition, increasing CAC pressure.
- Analyze churn by cohort and lifecycle stage:
- Early churn → onboarding failure
- Late churn → product or pricing misalignment
- Use behavioral analytics:
- Track declining engagement signals (feature usage, session frequency)
- Implement pre-churn intervention systems:
- Automated outreach triggered by inactivity patterns
Churn reduction is often the highest-leverage growth activity, as it compounds across all acquisition efforts.
5. The Rule of 40
The Rule of 40 is a financial benchmark stating that a company’s revenue growth rate plus profit margin should equal or exceed a certain percentage. It functions as a constraint on growth strategy, ensuring expansion does not come at the expense of financial stability.
- Use it to balance reinvestment vs profitability:
- High growth → accept lower margins
- Low growth → prioritize profitability
- Track it at both the company and segment levels
- Align internal targets with investor expectations
The Rule of 40 is most valuable when used as a portfolio-level metric, not just a single KPI.
6. Activation Rate
Activation rate measures the percentage of users who reach a predefined value moment, where the product’s core utility becomes clear. Activation is the transition point between acquisition and retention.
- Define activation using behavioral milestones, not generic actions:
- Example: completing a workflow, generating output, and inviting collaborators
- Optimize onboarding around a single critical path
- Use progressive disclosure:
- Introduce complexity only after the initial value is achieved
Activation improvements typically reduce both churn and CAC, as more users convert into long-term customers.
7. Viral Coefficient
The viral coefficient measures how many additional users each existing user generates through referrals or network effects. It determines whether growth can become self-sustaining.
- Identify natural sharing points:
- Invitations, collaboration features, and content outputs
- Incentivize referrals without degrading product quality
- Measure the conversion rate of referred users, not just the invites sent
A high viral coefficient reduces dependency on paid acquisition and improves overall unit economics.
8. Conversion Rate (CVR)
Conversion rate (CVR) measures the percentage of users who complete a desired action within a defined funnel stage. CVR is a multiplicative lever, where small improvements compound across the entire acquisition funnel.
- Break CVR into micro-conversions:
- Click → signup → activation → purchase
- Use statistical methods (e.g., Bayesian inference) to evaluate experiments with smaller datasets
- Optimize for clarity and friction reduction, not just visual design
Improving CVR increases output from existing traffic, effectively lowering CAC.
9. Payback Period
The payback period measures the time required to recover the cost of acquiring a customer (CAC) through generated revenue. It is a direct indicator of cash flow efficiency.
- Model payback at the cohort level
- Align payback targets with capital constraints:
- Shorter payback for bootstrapped or capital-limited companies
- Improve payback through:
- Faster onboarding
- Higher upfront pricing
- Reduced servicing costs
Shorter payback cycles allow faster reinvestment, accelerating growth velocity.
10. AI Search Visibility
AI search visibility measures how often a brand is cited in AI-generated responses, driven by Generative Engine Optimization (GEO), which focuses on structuring content for machine-readable authority and citation. This metric reflects a shift from click-based discovery to answer-based visibility.
- Structure content for entity recognition:
- Clear definitions, consistent terminology, named entities, and sourceable claims
- Publish high-authority, citation-worthy content:
- Original data, expert commentary, comparison frameworks, benchmarks, and updated guides
- Track AI citation share across platforms:
- ChatGPT, Perplexity, Gemini, Claude, Google AI Overviews, and vertical AI search tools
- Measure Zero-Click Attribution:
- Monitor branded search lift, direct traffic changes, CRM source patterns, sales-call mentions, and self-reported attribution from users who discovered the brand through AI answers
- Track Age of Citations:
- Measure how recently cited pages are and how often AI systems cite content published or refreshed within the last 90 days
Visibility in AI systems increasingly determines brand exposure, even without direct traffic.
The 90-Day Freshness Rule
AI search visibility is increasingly shaped by content freshness. Growth teams should track the age of citations, which measures how old the content is when it gets cited by AI answer engines.
Content under three months old is significantly more likely to be cited by LLMs than older content. As a result, GEO reporting should not only measure whether a brand is cited, but also whether the cited asset is fresh, accurate, and recently updated.
The goal is not to update every page constantly. The goal is to keep high-value, sourceable pages fresh enough to remain eligible for AI citation.
11. Average Revenue Per User (ARPU)
Average Revenue Per User (ARPU) measures the average revenue generated per active user over a given period. ARPU reflects the depth of monetization within the existing user base.
- Segment ARPU by:
- Pricing tier
- Customer type
- Increase ARPU through:
- Tiered pricing structures
- Usage-based billing
- Feature expansion
- Monitor ARPU alongside churn:
- Growth in ARPU should not come at the cost of retention
ARPU optimization improves profitability without requiring additional acquisition.
How to Use These Metrics Together
Growth metrics operate as an interconnected system, where each combination produces a measurable outcome that directly informs strategic decisions across acquisition, retention, monetization, and capital allocation.
- CAC + LTV → Economic Viability
The relationship between Customer Acquisition Cost (CAC) and Customer Lifetime Value (LTV) determines whether each acquired customer generates positive net value. This is quantified through the LTV:CAC ratio and net contribution margin per customer. When LTV meaningfully exceeds CAC, acquisition can be scaled with confidence; when the gap narrows, it signals structural inefficiencies in pricing, retention, or targeting.
- Activation Rate + Churn Rate → Retention Stability
Activation rate captures how many users reach a defined value milestone, while churn rate reflects the rate of user loss over time. Together, they reveal whether acquired users are converting into retained customers or exiting early. A high activation rate paired with high churn typically indicates downstream product issues, while low activation suggests onboarding friction or unclear value delivery.
- ARPU + Payback Period → Cash Flow Efficiency
Average Revenue Per User (ARPU) measures revenue generation per customer, while the payback period determines how long it takes to recover acquisition costs. Their interaction defines how quickly capital invested in growth returns to the business. Faster payback cycles enable more aggressive reinvestment, while slower cycles constrain scaling due to capital lock-up.
- CVR + Viral Coefficient → Growth Efficiency
Conversion rate (CVR) measures how effectively traffic converts into users, while the viral coefficient measures how users generate additional users through referrals or network effects. Together, they determine whether growth depends primarily on paid acquisition or benefits from compounding organic expansion. Improvements in these metrics increase output without proportional increases in spend.
These relationships form a closed-loop growth system in which changes in one metric propagate across others, making isolated optimization less effective than system-level improvement.
What Operational Constraints Limit Growth in 2026?
Beyond core metrics, growth is constrained by system-level factors such as technical debt and real-time user intent modeling. These factors determine how efficiently metrics can be improved over time.
- Technical Debt Slows Down Product Development and Limits Growth
Technical debt refers to accumulated inefficiencies in systems, code, or processes that increase future maintenance costs and reduce development velocity.
To check:
- Monitor system complexity as a scaling constraint
- Allocate resources to:
- Continuous refactoring
- Use automated tools to detect:
- Redundancies and structural inefficiencies
- Redundancies and structural inefficiencies
User Intent Affects Conversion Rates and Growth Efficiency
User intent measures real-time behavioral and semantic signals that indicate likelihood to convert, often expressed as intent velocity, or the speed of progression from discovery to purchase. In 2026, intent modeling increasingly depends on centralized data pipelines that combine product analytics, CRM data, website behavior, and content engagement.
To check:
- Prioritize high-intent users in acquisition and sales workflows
- Replace static lead scoring with dynamic behavioral models
- Use vector databases to connect semantic signals, behavioral history, and conversion likelihood
- Feed intent data back into campaign targeting, lifecycle messaging, and sales prioritization
Intent-driven systems improve conversion efficiency and reduce wasted acquisition spend.
Final Thoughts
To transition to a more sustainable growth model, readers should consider these actionable steps:
- Move beyond blended averages to analyze cohort-based LTV, segmented CAC, and Contribution Margin LTV to identify where the business is truly profitable.
- Build centralized data pipelines using tools such as Segment, Snowflake, or Claude-powered analytics to connect acquisition, product, revenue, and retention data.
- Use vector databases and behavioral models to track real-time intent rather than relying only on static lead scoring.
- Structure high-authority content for entity recognition, AI citation, and Zero-Click Attribution across answer engines.
- Track the age of citations and refresh priority content every 90 days to improve AI search visibility.
Frequently Asked Questions (FAQs)
What is the most important growth metric?
The LTV:CAC ratio is often the most informative because it directly measures whether acquisition spend produces sustainable returns.
Why is CAC increasing?
Increased competition, higher advertising costs, and saturation of traditional channels are driving CAC upward.
What is AI search visibility?
It measures how often your brand appears in AI-generated answers, reflecting your presence in non-click-based discovery systems.
Read These Next

B2B Marketing Automation: 7 Workflows to Shorten Your Enterprise Sales Cycle