.png)
SaaS Growth Metrics: The Only 7 Numbers That Truly Matter for Your MRR
.png)

.png)

What SaaS metrics matter for MRR in 2026?
In 2026, the seven critical SaaS metrics for MRR growth are Net Revenue Retention (NRR), LTV:CAC Ratio, CAC Payback Period, Expansion Revenue, Gross Margin, Rule of 40, and Trial-to-Paid Conversion. These metrics prioritize capital efficiency and account expansion, specifically accounting for the variable compute costs and usage-based revenue shifts inherent in AI-driven business models.
Key Takeaways
- In 2026, MRR is moving away from traditional seat-based subscriptions toward usage-based billing and outcome-driven pricing where software acts as a worker.
- Success is measured through an integrated system of seven metrics: NRR, LTV:CAC, CAC Payback Period, Expansion Revenue, Gross Margin, Rule of 40, and Trial-to-Paid Conversion.
- Net Revenue Retention (NRR) above 100% is vital, as it allows for compounding growth without relying solely on new customer acquisition.
- Companies must monitor margin compression caused by AI compute costs and manage the revenue volatility inherent in consumption-based models.
- The Rule of 40 remains the gold standard for balancing revenue expansion with healthy profit margins.
How is MRR changing in 2026?
Monthly Recurring Revenue (MRR) is the predictable monthly income generated from active subscriptions. In 2026, MRR is no longer purely subscription-based. It increasingly reflects:
- Usage-based billing models
- Credit-based consumption systems
- Outcome-driven pricing (e.g., tasks completed by software)
This shift introduces variability in revenue recognition while increasing expansion potential per account. As a result, evaluating MRR requires a tighter focus on retention, efficiency, and monetization metrics.
Notable Shifts for MRR in 2026
MRR in 2026 is moving away from fixed subscription models toward usage-based and outcome-driven revenue. As AI systems increasingly perform work instead of supporting it, revenue becomes more variable, higher per account, and more dependent on actual product usage.
From seat-based pricing to outcome-based revenue
Traditional per-seat pricing is declining. Revenue is increasingly tied to the amount of work completed by software—such as tasks handled by AI systems—rather than the number of users.
This shift increases:
- Revenue variability across billing cycles
- Monetization per account through higher-value outcomes
SaaS evolving into hybrid “software + service” models
SaaS products are no longer just tools. Many now deliver completed outputs (e.g., resolved tickets, generated reports), blending software with service-like value.
As a result:
- MRR behaves more like a usage-based utility
- Revenue scales with workflow volume, not just subscriptions
Expansion revenue driven by AI capabilities
Customers are increasingly willing to pay more for software that replaces manual work rather than assists it.
This leads to:
- Higher expansion revenue from existing accounts
- Increased adoption of add-ons and automated features
- Greater reliance on value-based pricing models
Reduced predictability in recurring revenue
As billing shifts toward consumption, MRR becomes less predictable.
To manage this, companies are adopting:
- Usage forecasting instead of fixed subscription projections
- Burn-rate models to estimate how quickly prepaid credits are consumed
The rise of usage-based billing
Consumption-based pricing models are replacing fixed tiers. Many companies now use credit systems where customers prepay for usage (e.g., compute, API calls).
This introduces a key distinction:
- Bookings: Revenue collected upfront
- Recognized MRR: Revenue earned as usage occurs
Many SaaS companies are adopting hybrid pricing models, where customers pay a base subscription plus variable usage fees. Others use credit drawdown models, where customers prepay for credits and consume them through API calls, AI tasks, compute usage, or workflow automation.
AI as a revenue-generating “worker”
Software is increasingly purchased as a substitute for human labor, not just a productivity tool.
This shift results in:
- Higher contract values tied to output, not access
- Stronger expansion potential as usage scales
- Increased churn risk if the software fails to deliver expected outcomes
The seven metrics below work together as a diagnostic system for SaaS operators: NRR shows whether the existing base is expanding, LTV:CAC and CAC Payback show whether growth is efficient, Gross Margin shows whether AI usage is profitable, and the Rule of 40 shows whether growth and profitability are in balance.
7 Important SaaS Metrics that Drive MRR Growth
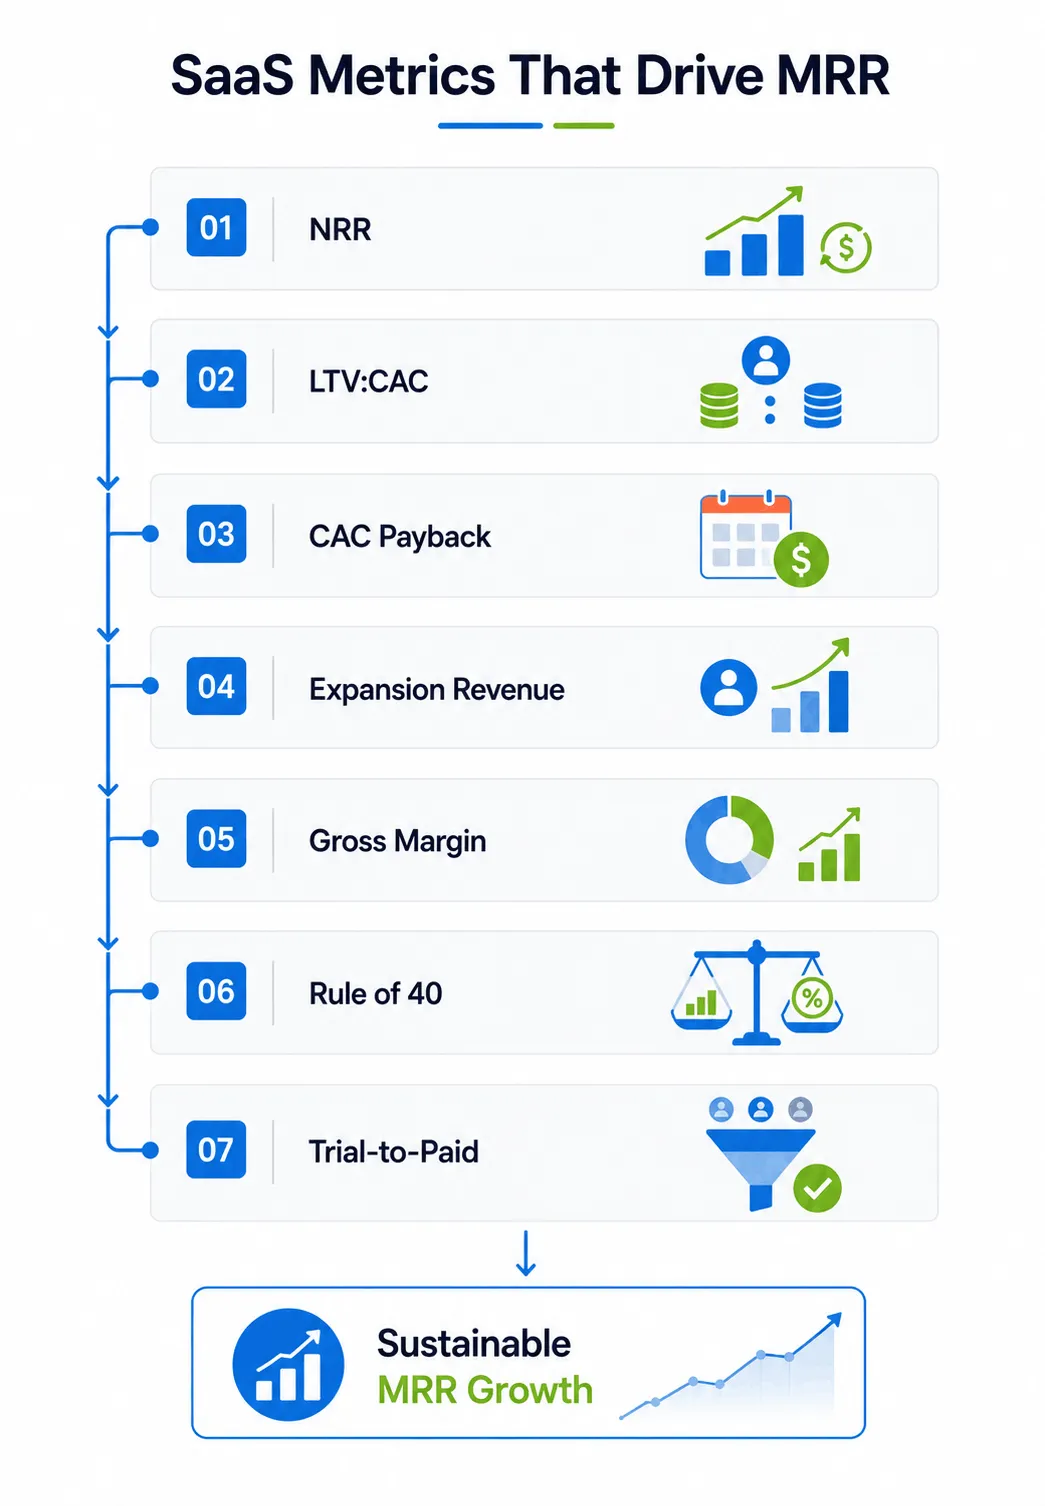
Sustainable MRR growth in 2026 depends on a tightly connected set of metrics that track retention, monetization, and capital efficiency. Rather than evaluating growth through isolated indicators, these seven metrics function as an integrated system, revealing whether revenue is compounding, efficiently acquired, and profitable under usage-based and AI-driven models.
SaaS MRR Metrics Breakdown (Definitions, Benchmarks, and Use Cases)
1. NRR for Measuring SaaS Growth
Net Revenue Retention (NRR) measures the percentage of recurring revenue retained from existing customers. NRR above 100% remains the minimum signal that expansion revenue is offsetting churn and contraction. But in 2026, the stronger benchmark is not a single universal number.
High Alpha’s SaaS Benchmarks Report separates performance into “Good” median and “Great” upper-quartile benchmarks by ARR band (companies are grouped by their annual recurring revenue size). This makes NRR more useful when compared against companies at a similar stage.
Companies with higher NRR and lower CAC typically grow faster and score materially better on the Rule of 40 than peers with weaker retention or longer payback periods.
How to use NRR:
- Diagnose product-market fit through expansion behavior
- Segment NRR by cohort to identify retention gaps
- Track expansion vs contraction drivers (pricing, usage, feature adoption)
2. LTV:CAC for Customer Acquisition Efficiency
The LTV:CAC ratio compares the total lifetime value of a customer (LTV) to the cost required to acquire that customer (CAC). SaasHero in 2026 reports that a ratio below 3:1 suggests inefficient acquisition, while ratios significantly above 5:1 may indicate underinvestment in growth.
While these numbers are a common baseline, the ratio widely depends on your business size, industry, and overall customer performance.
How to use LTV:CAC
- Adjust marketing spend based on marginal returns
- Identify high-value customer segments worth higher CAC
- Align pricing strategy with long-term value capture
3. CAC Payback Period for Managing Growth Speed
CAC Payback Period measures how many months it takes to recover the cost of acquiring a customer from the revenue they generate. For large service-enterprise companies, a CAC Payback Period exceeding 24 months (Datadog, 2025) raises questions about the scalability of the growth model.
For lower-ACV SaaS, shorter payback windows are especially important because customers may churn before the company recovers acquisition costs.
For enterprise SaaS, longer payback periods may be acceptable if gross retention, expansion revenue, and contract length are strong.
How to use CAC Payback
- Model cash flow constraints under different growth scenarios
- Prioritize acquisition channels with faster recovery cycles
- Improve onboarding and activation to accelerate revenue realization
4. Expansion Revenue for Scaling from Existing Customers
Expansion Revenue is the portion of MRR generated from existing customers through upsells, cross-sells, and additional usage. Mature SaaS companies often contribute up to 40 to 50% of new expansion revenue to their annual revenue (Involve Digital, 2026).
In usage-based and AI-driven SaaS, expansion revenue may come from higher workflow volume, more credits consumed, additional AI capabilities, or outcome-based fees rather than traditional seat expansion.
How to use Expansion Revenue
- Design pricing models that scale with customer value (usage-based tiers)
- Track expansion by feature, product line, or AI capability
- Identify accounts with high expansion potential vs churn risk
5. Gross Margin for Maintaining Profitability
Gross Margin is the percentage of revenue remaining after deducting the direct costs of delivering the service. AI SaaS must monitor COGS (Cost of Goods Sold) more tightly than traditional SaaS. For instance, while Datadog achieves 80–81% gross margin in 2025, this still trails behind pure-software peers because of its heavy reliance on third-party cloud infrastructure like AWS.
For AI SaaS, COGS can also include GPU inference, model API fees, vector database hosting, data storage, and other usage-based infrastructure costs. For traditional SaaS, COGS may include cloud hosting, third-party software fees, customer support, and payment processing costs.
AI Gross Margin is calculated by subtracting the direct costs of delivering your AI product from revenue, then dividing the result by revenue.
AI Gross Margin = (AI Revenue - AI COGS)÷AI Revenue (100)
For example, if an AI SaaS product generates $100,000 in monthly revenue and spends $25,000 on GPU inference, model APIs, vector database hosting, and usage-based support, its AI Gross Margin is 75%.
This matters because AI products can show strong MRR growth while quietly losing profitability if pricing does not keep pace with usage costs.
How to use Gross Margin
- Monitor cost-to-serve by feature or customer segment
- Evaluate pricing relative to infrastructure cost curves
- Prevent margin erosion from high-cost AI usage
6. Rule of 40 for Balancing Growth and Profitability
The Rule of 40 benchmarks the balance between growth and profit. A combined score of 40% or higher indicates elite performance. Saas Capital Insights in 2025 reports that a 25% growth rate is below the median for a $2M SaaS, but above the median for a $20M organization.
In the current SaaS market, many healthy companies fall below 40 while they improve margins, absorb AI infrastructure costs, or rebalance from growth-at-all-costs toward capital efficiency.
How to use the Rule of 40
- Evaluate strategic trade-offs between scaling and efficiency
- Benchmark performance against public SaaS companies
- Identify whether underperformance is driven by growth or margins
Because the Rule of 40 can hide cash burn, operators should pair it with capital efficiency metrics such as Burn Multiple, which measures how much net burn is required to generate each dollar of new ARR. A lower Burn Multiple indicates that growth is being created more efficiently.
7. Trial-to-Paid Conversion Rate for Optimizing Growth Funnels
Trial-to-Paid Conversion Rate measures the percentage of users who convert from a free trial into paying customers. Based on the ChartMogule 2026 Report, SaaS platforms reach conversions within 7 days, likely after the trial period has ended for users.
This transition depends on:
- PLG Motion: Self-service sales driven by the product itself
- ACV: The average annual dollar value of a customer contract
- Onboarding Depth: How effectively a user is guided to the product's value
- Product Complexity: How difficult the software is to learn and use
For AI SaaS products, trial conversion should be evaluated alongside activation quality. A user who tests an AI feature once is less valuable than a user who builds the product into a recurring workflow, consumes credits, or reaches a measurable outcome during the trial period.
How to use Conversion Rate
- Identify friction points in onboarding flows
- Measure time-to-value and activation success
- Optimize product-led growth funnels
Key implications for SaaS operators
MRR is no longer a purely predictable subscription metric. It is becoming a function of usage, value delivered, and cost efficiency, requiring tighter alignment between pricing, product performance, and customer outcomes.
Risks and trade-offs to monitor
As MRR becomes more usage-driven and AI-dependent, several structural risks emerge:
- Revenue volatility
Usage-based pricing introduces fluctuations in monthly revenue, making forecasting less stable compared to fixed subscriptions.
- Margin compression from AI costs
Compute, inference, and API costs can scale faster than revenue if pricing is not tightly aligned with usage.
- Misleading revenue signals
High bookings from prepaid credits can mask weak actual usage, creating a gap between cash collected and true MRR performance.
- Higher churn sensitivity
When software replaces labor, failure to deliver expected outcomes leads to faster and more decisive churn.
- Over-reliance on expansion revenue
Growth driven primarily by upsells can hide weak new customer acquisition or declining product-market fit.
- Forecasting complexity
Traditional MRR models break down under consumption-based billing, requiring new approaches like cohort-based usage tracking and burn-rate forecasting.
Final Thoughts
In 2026, MRR is no longer just a subscription number. It is a signal of usage, retention, expansion, pricing quality, and AI cost discipline.
Next steps:
- Transition from seat-based models to usage-based tiers or credit systems to capture the value of AI-driven tasks.
- Replace fixed projections with burn-rate models to better estimate revenue from prepaid credits.
- Closely track AI infrastructure costs to prevent margin erosion as usage scales.
- Focus on feature adoption and "expansion behavior" to ensure the existing customer base drives compounding growth.
Frequently Asked Questions (FAQs)
How is MRR different in 2026?
MRR is no longer just a predictable subscription fee. It now increasingly reflects credit-based consumption and tasks completed by AI, making revenue more variable but increasing the potential for expansion per account.
Why is Gross Margin becoming more important for AI SaaS?
AI products incur high variable costs for inference and compute. If these costs aren't controlled, they can scale faster than revenue, shrinking the company's overall profitability.
How do I calculate AI Gross Margin?
AI Gross Margin is calculated by subtracting the direct costs of delivering your AI product from revenue, then dividing the result by revenue.
AI Gross Margin = (AI Revenue - AI COGS)÷AI Revenue (100)
AI COGS includes direct costs such as GPU inference, model API fees, vector database hosting, cloud infrastructure, data storage, and support tied to usage.
What is the Rule of 40?
It is a health check for SaaS businesses calculated by adding the revenue growth rate to the profit margin. A score of 40% or higher suggests the company has a healthy balance between scaling and efficiency.
Read These Next

Marketing Automation Workflow: How to Design High-Converting Sequences from Scratch