.png)
SaaS Performance Marketing: The Complete Product-Led Growth Playbook
.png)

.png)

SaaS performance marketing in a product-led growth model uses the product as the primary acquisition and conversion channel. PLG aligns paid campaigns, organic acquisition, and in-product experience to reduce CAC and increase lifetime value. In 2026, the median free-to-paid conversion rate sits at 9%, and companies using Product Qualified Leads convert at 3x the rate of those relying on marketing signals alone.
Introduction
Most SaaS companies treat performance marketing and product-led growth as separate disciplines. Paid acquisition sits with the growth team. Product experience sits with product. The result is a disconnected system where campaigns drive signups that the product fails to convert, and retention is managed separately from acquisition.
This misalignment is expensive. Acquisition costs in SaaS have risen as paid channels become more competitive, and privacy changes have reduced targeting precision across search and social. At the same time, buying behavior has shifted. Decision-makers — particularly in APAC, the US, and Australia — increasingly expect to evaluate software before speaking to sales. According to ProductLed, over 400 SaaS companies have used product-led systems to generate more than $1 billion in self-serve revenue collectively, reflecting how central the product experience has become to commercial outcomes.
Performance marketing in a Product-led growth (PLG) context is not just about driving traffic. It is about how traffic, product experience, and conversion signals work together as a system. When that system is aligned, acquisition costs decrease, free-to-paid conversion improves, and retention becomes a growth lever rather than a cost center.
What This Guide Covers
This guide explains how SaaS performance marketing works within a product-led growth model and how to optimize each stage to reduce acquisition costs and improve conversion efficiency.
It covers:
- What SaaS performance marketing means in a PLG context
- How the PLG funnel differs from traditional SaaS acquisition models
- How to optimize each stage from awareness through expansion
- Where the most common drop-offs occur and how to address them
- How AI automation and privacy changes affect PLG performance
- What realistic performance benchmarks look like across funnel stages
What Is SaaS Performance Marketing in a Product-Led Growth Model?
SaaS performance marketing in a PLG model is a data-driven approach where acquisition, activation, and retention are optimized together — using the product as the central conversion mechanism. Performance is measured across the full user journey, from first click to paid conversion and repeat use.
In a traditional sales-led model, marketing generates leads and hands them to sales. In a PLG model, the product takes on that role. A user signs up, experiences value directly, and converts without speaking to anyone. This changes what performance marketing needs to optimize for. A PLG-aligned system tracks what happens after the click:
- Activation rate — did the user reach a meaningful product moment?
- Time to value — how quickly did they get there?
- Feature adoption — are they using the capabilities that drive retention?
- Free-to-paid conversion — did product experience translate into revenue?
A paid campaign that drives signups but delivers users who never activate is not performing well, even if CPA looks acceptable on paper.
How Does a PLG Funnel Differ From a Traditional SaaS Funnel?
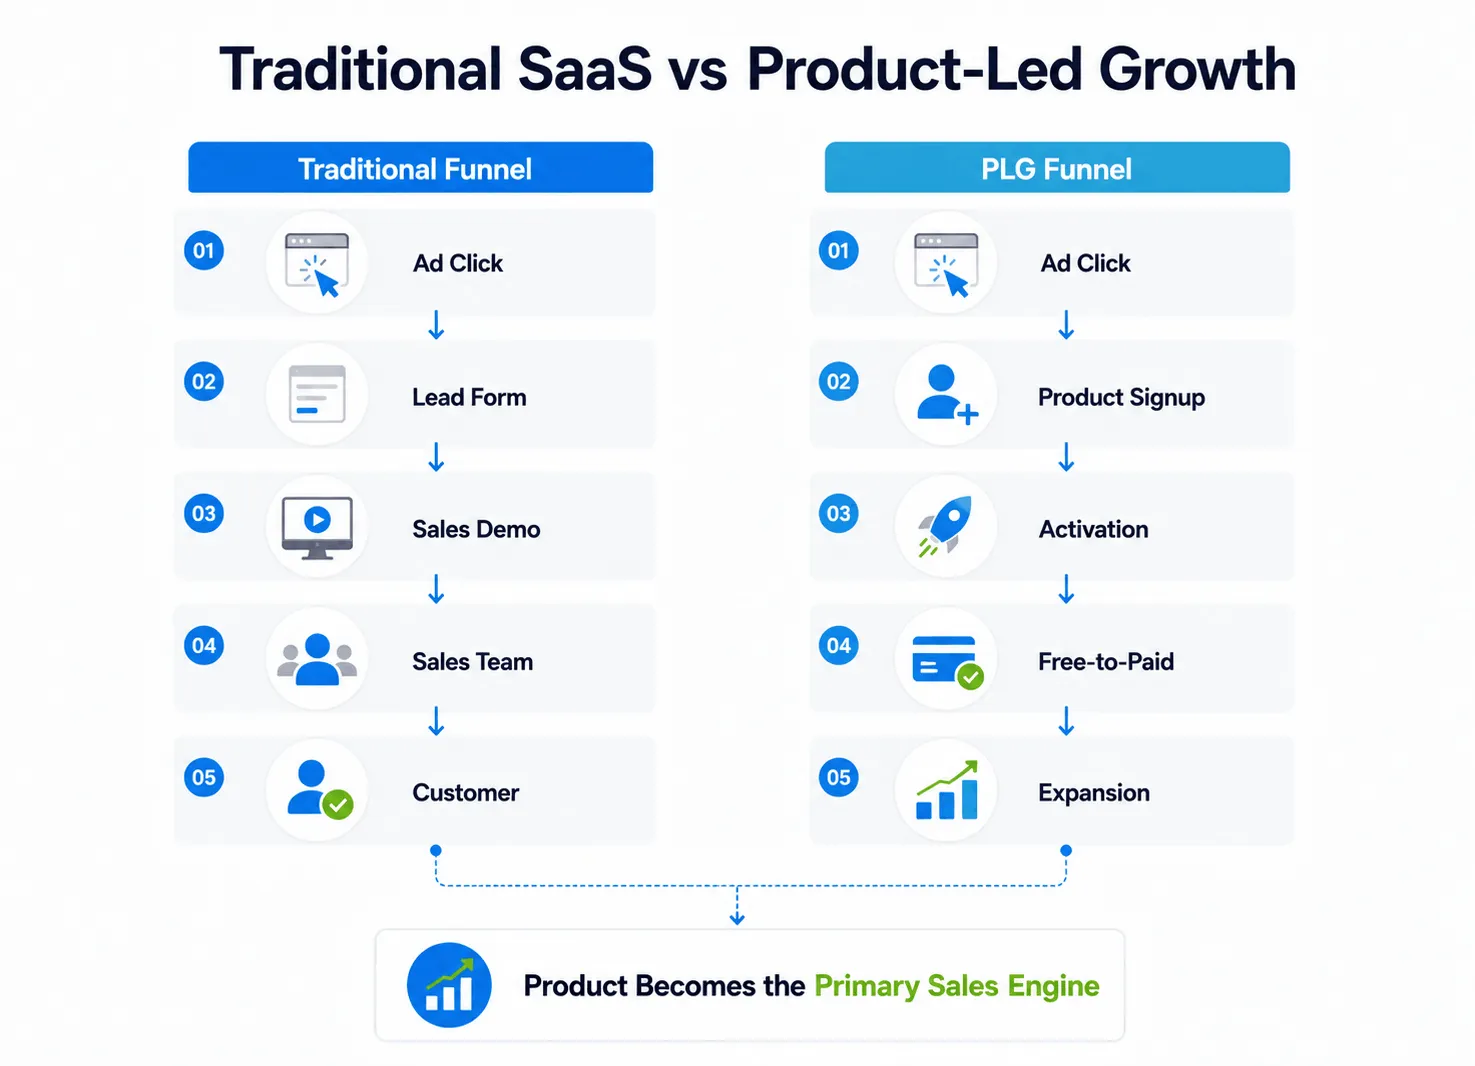
A PLG funnel replaces the sales-qualified lead with the product-qualified lead. Instead of moving users from ad click to demo request to sales conversation, the funnel moves users from acquisition through in-product activation to self-serve conversion and expansion.
In a traditional funnel, marketing is accountable for MQLs and sales is accountable for conversions. In a PLG model, that boundary dissolves. Both functions depend on the same product signals, which means performance cannot be measured in isolation at either end.
Each stage depends on the one before it. Strong awareness with weak activation produces high signup volume and low revenue. Strong conversion with weak retention increases pressure on acquisition to compensate for a leaky base.
The Sales-Assist motion. In 2026, pure self-serve is no longer the default for most PLG companies. The more common model is a hybrid: the product handles initial acquisition and activation, and a PQL signal — triggered by a user hitting a usage threshold, inviting a teammate, or reaching a key feature gate — routes a high-intent account to a human salesperson. This is the Sales-Assist motion, and it is now standard practice across mid-market SaaS. Sales does not initiate contact at the top of the funnel; it enters when the product has already demonstrated intent. The media buying implication is that campaigns cannot be evaluated purely on self-serve conversion volume. Pipeline generated through PQL-triggered sales conversations needs to be attributed back to the acquisition channels that sourced those users. Without CRM integration, connecting product behavior to sales outcomes, that attribution is invisible.
How Do You Optimize the Awareness Stage in SaaS PLG?
Awareness in a PLG model is about attracting users who are likely to activate, not just users who are likely to click. Traffic quality matters more than traffic volume because low-fit users inflate signup numbers without contributing to conversion.
The shift in how leading PLG companies approach awareness is instructive. Canva has built product-led SEO at scale, creating pages that rank for high-intent queries like "build an Instagram post" and delivering a functional tool experience before a user signs up. The acquisition channel and the product experience become the same surface — a model that contrasts sharply with the broad brand advertising that defined earlier PLG playbooks.
For decision-makers across APAC, the US, and Australia, paid search captures users with existing intent while content and SEO capture users earlier in the evaluation process. Both need to align with what the product delivers at activation, otherwise the funnel breaks at the first handoff.
Key optimization areas:
- Use first-party and lookalike data to reach users who resemble those who have already activated and converted
- Align ad messaging with the specific job the product performs, not the category it belongs to
- Coordinate paid and organic channels so users receive consistent messaging across surfaces
Benchmark context: Paid search in SaaS typically generates CTRs between 3% and 6% for high-intent queries, though performance depends heavily on keyword specificity and landing page alignment.
How Do You Optimize the Activation Stage?
Activation is where most PLG funnels break. A user signs up, encounters friction, fails to reach a meaningful product moment, and churns before converting. No amount of campaign optimization compensates for poor activation once users are already in the product.
A meaningful product moment is the specific in-product action that correlates with a user continuing to return and, eventually, converting to paid. It is not the same as completing onboarding steps. For Slack, it has historically been sending 2,000 team messages. For Dropbox, it was saving a first file across devices. For a project management tool, it might be creating a task and assigning it to a teammate. The point at which a user first experiences the core value the product was built to deliver — that is the meaningful product moment. Identifying it requires cohort analysis: which early actions correlate with 30-day retention and free-to-paid conversion in your actual user data.
Activation depends on three things working together:
- Onboarding flow — guides users toward value without unnecessary steps
- Product design — reduces friction along the path to the first meaningful moment
- Pre-signup messaging — sets correct expectations so users arrive knowing what to do
When these are misaligned, activation rates drop regardless of how well individual components perform. An ad that promises one outcome and a product that delivers a different first experience will consistently underperform.
Decision clarity: If free trial to activation rate is below 40%, the onboarding flow is the first place to investigate. If activation is adequate but free-to-paid conversion is low, the issue is more likely in how value is communicated at the conversion gate.
How Do You Optimize Free-to-Paid Conversion?
Free-to-paid conversion is the commercial hinge of the PLG model — where product experience translates into revenue. Conversion optimization is largely about how the free model is structured: what is available without payment, what is gated, and when the product surfaces the upgrade prompt.
An effective free model needs to be valuable enough that users engage seriously, and constrained enough that they encounter a genuine reason to upgrade. Free models that give away too much delay conversion indefinitely. Models that restrict too aggressively increase churn before conversion is possible.
Pricing structure matters as well. Products priced on usage or seat count create natural expansion triggers as users grow. Flat pricing tends to produce a single conversion event with limited expansion revenue thereafter.
Free Trial vs. Freemium vs. Strategic Freemium — Model Comparison
Source: ChartMogul / ProductLed SaaS Conversion Report (January 2026, n=200 products); SaaSFactor Freemium vs. Trial benchmarks (February 2026).
Benchmark context: The median free-to-paid conversion rate across all PLG products sits at approximately 8–9%, per a January 2026 study of 200 B2B software products by ChartMogul and ProductLed. Freemium-only models typically sit at 2–5%. A rate below 2% generally indicates a structural issue — most commonly either a free tier that delivers too much without payment, or an onboarding flow that fails to route users to the activation moment before they disengage. A structural issue differs from a volume problem: if activation rates are healthy but conversion is low, the issue is in the paywall design or the upgrade trigger, not the product experience itself.
How Do You Optimize Retention and Expansion?
Retention directly affects the economics of acquisition. If net revenue retention is below 100%, the business is losing revenue from existing customers faster than it is adding new ones — meaning acquisition spend is compensating for a leaky base rather than driving net growth.
Expansion is the highest-leverage motion in PLG. It requires no additional acquisition spend and compounds over time. Figma crossed $1 billion in annual revenue run rate partly through expansion within existing accounts as more team members adopted the product.
Key levers for retention and expansion:
- Lifecycle email and in-app messaging tied to product behavior, not arbitrary time intervals
- Usage-based triggers that surface upgrade prompts when a user approaches a meaningful limit
- Team and collaboration features that create organic seat expansion within accounts
Decision clarity: Net revenue retention above 110% indicates an expansion motion outpacing churn. Below 90% indicates a retention problem that will constrain growth regardless of acquisition performance.
Where Do PLG Funnels Most Commonly Break?
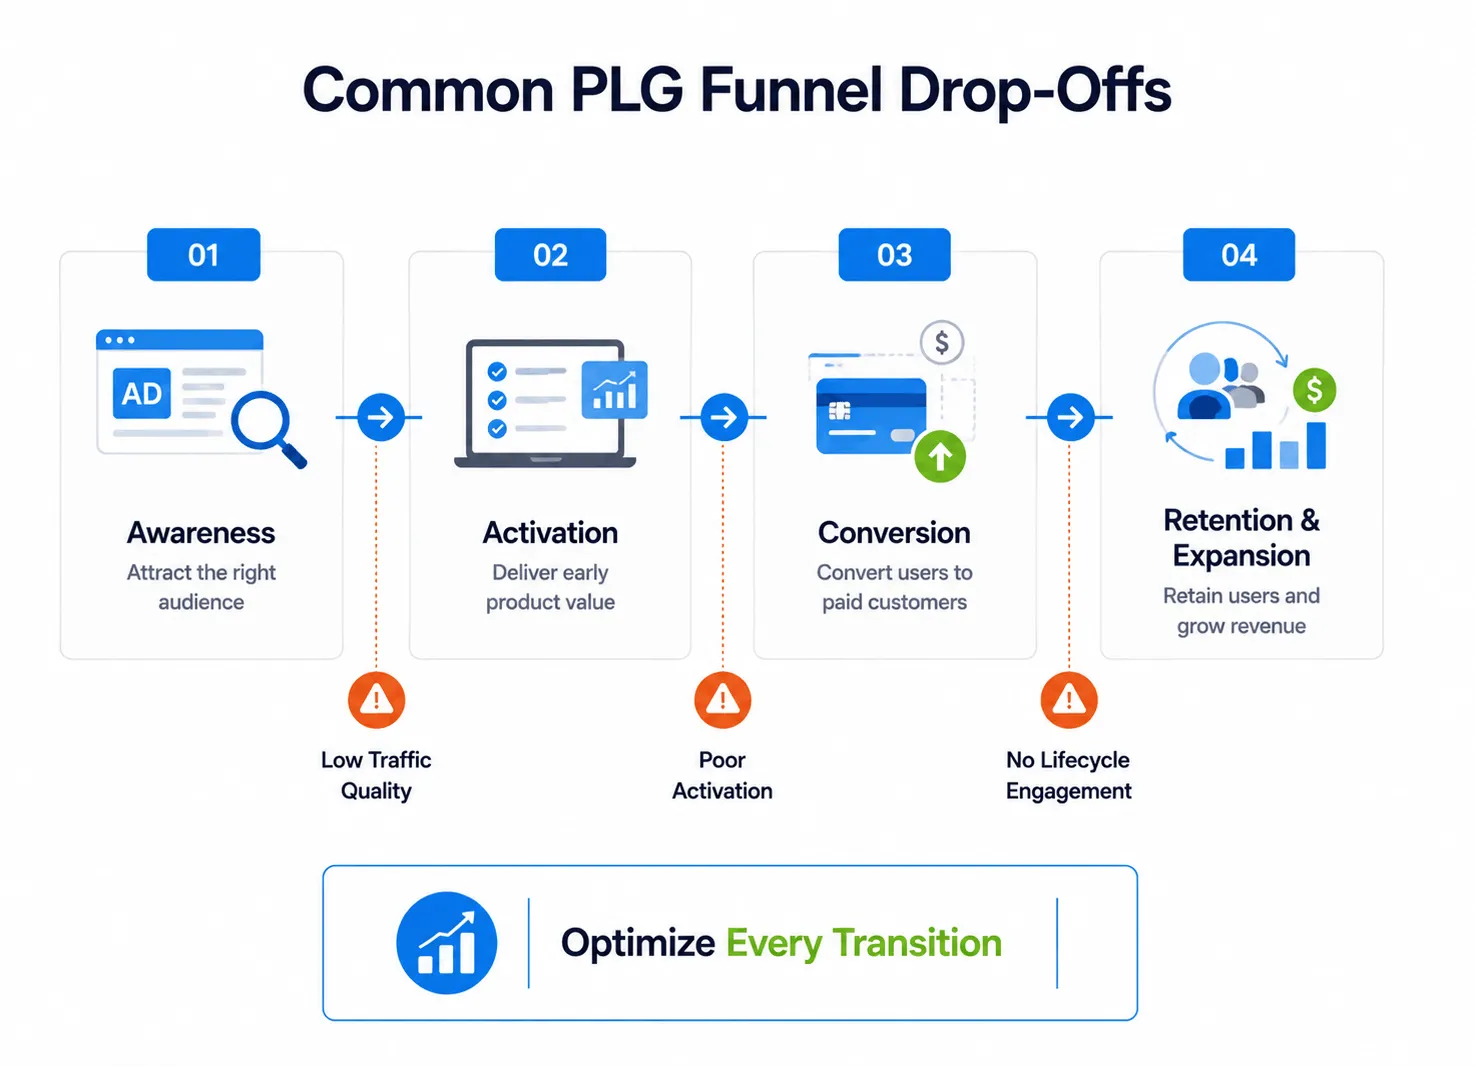
Failure points concentrate at three transitions rather than being evenly distributed across the funnel.
Awareness to activation breaks when traffic quality is low or when the product experience fails to match the expectation set by the acquisition channel. The fix is upstream — in targeting and message alignment — not in the product.
Activation to conversion breaks when users experience the product but do not perceive sufficient value to pay. Users who activate but do not convert within 14 to 30 days rarely convert later without a specific intervention.
Conversion to retention breaks when the post-purchase experience does not sustain the value that drove conversion — most often when onboarding ends at signup and no lifecycle communication follows.
Each transition needs its own measurement. Monitoring signup volume alone does not reveal where users are exiting.
How Do AI and Privacy Changes Affect SaaS PLG Performance Marketing?
AI-driven platforms like Google Performance Max and Meta Advantage+ have improved delivery efficiency but reduced manual control over placement and audience targeting. For PLG companies, the core challenge is that the conversion event that matters most — product activation — is harder to pass back to ad platforms than a standard form submission. Campaigns optimized for signup volume can perform well by platform metrics while underperforming on the metric that actually predicts revenue.
Privacy changes compound this. Signal loss from browser-based tracking means that 40% to 60% of attributed conversions on some platforms are now modeled rather than directly observed. Attribution becomes less precise, and performance needs to be evaluated across multiple data sources rather than relying on any single platform's reporting.
The practical response is to build tracking infrastructure that does not depend on third-party signals:
- Server-side tagging via server-side Google Tag Manager (sGTM) or equivalent to reduce data loss from browser restrictions; sGTM allows conversion events — including activation milestones — to fire server-to-server, bypassing client-side blocking entirely
- CRM integration to connect product behavior with revenue outcomes — PQL routing through HubSpot or Salesforce is the standard approach, where a behavioral score threshold in the product triggers automated assignment to a sales rep or a high-intent nurture sequence
- Passing activation events — not just signups — as conversion signals to ad platforms, so bidding algorithms optimise toward users likely to activate rather than users likely to click
- Privacy-first analytics tools such as Matomo for teams requiring cookieless measurement or data residency compliance across APAC markets
On the retention side, owned channels — email, in-app messaging, and CRM-driven lifecycle flows — become more important as paid retargeting becomes less precise. First-party behavioral data from the product is the most durable signal available.
What Does Good Performance Look Like in SaaS PLG?
Good performance is defined by consistency across funnel stages, not strong numbers at any single point. The system is only performing well when each stage converts at a rate that sustains growth without requiring disproportionate spend to compensate.
Directional benchmarks across the funnel:
- Paid search CTR: 3%–6% for high-intent SaaS queries
- Signup to activation rate: 40%–60% for well-designed onboarding flows
- Free-to-paid conversion: 2%–5% for freemium; 8%–9% median across all PLG models; above 9% typically indicates a strong product-market fit and well-structured free tier
- 30-day retention post-conversion: 70%–85% for products with strong engagement design
- Net revenue retention: 100%–120% for healthy PLG businesses; above 120% in expansion-driven models
The right signal to scale is stability across all funnel stages over a sustained period — not signup volume or platform-reported ROAS alone.
Conclusion
SaaS performance marketing in a product-led growth model is not a campaign strategy — it is a system that connects acquisition, activation, conversion, and retention into a single accountable structure. Performance at any one stage depends on the stages around it.
The companies generating consistent PLG growth are not necessarily running better ads. They are building better alignment between what their acquisition channels promise and what their product delivers, and measuring outcomes at each funnel transition rather than at the top or bottom alone.
For decision-makers evaluating or scaling a PLG motion, the most useful starting point is identifying which funnel transition is most broken — and addressing that before increasing spend.
FAQs
What is product-led growth in SaaS?
Product-led growth is a go-to-market model where the product drives acquisition, conversion, and retention rather than relying primarily on outbound sales or paid advertising. Users sign up, experience value directly, and convert through the product itself.
How is performance marketing different in a PLG model?
In a PLG model, performance marketing is evaluated across the full funnel — from acquisition through activation and conversion — rather than stopping at signup or lead volume. The product experience is a direct component of marketing performance.
What is a product-qualified lead (PQL)?
A PQL is a user who has demonstrated buying intent through specific product behaviors — such as reaching a usage threshold or adopting a key feature — rather than through a form fill or sales interaction. PQLs typically convert at roughly 3x the rate of marketing-qualified leads, according to ProductLed benchmark data, though only about 25% of PLG companies currently use them.
What free-to-paid conversion rate should SaaS companies aim for?
Benchmarks vary by model. Freemium products typically convert at 2%–5%. The median across all PLG models — including free trials — sits at approximately 8%–9%, per a January 2026 study of 200 B2B software products by ChartMogul and ProductLed. Rates below 2% usually indicate a structural issue in the free tier or onboarding flow.
Read These Next
AI Marketing Automation: How to 10x Your Output with Machine Learning